
In Jan 2017 I completed an interesting piece of research work at a previous place of employment.
I worked on the Human Capital Management (HCM) app that the company produced as part of their ERP suite. It’s fairly safe to say that all of the HCM customers had to run Payroll on a regular basis. However, usage stats pointed to only a small percentage of those clients that actually used the built in payroll functionality.
This could be for various reasons and I was tasked with creating a research plan that would attempt to answer why adoption is so low.
The plan
Writing a research plan is important. It helps communicate to stakeholders the goals, questions, schedule and potentially the overall cost. But it isn’t just for stakeholders. It’s also for the researcher/designer. As soon as I started to put things in writing, I spotted gaps. The plan helped me fill them. It gave me focus and helped better prepare for the research.
The basic structure was as follows:
- What is the problem?
- What are the key questions we would like answering?
- How are we going to go about finding the answers to those questions (research activities)?
- What will be the measures of success (of the research, not the solution)?
The problem
Why do only 15% of HCM customers use the built in payroll functionality?
Key questions
- How are users currently completing the payroll process? For adopters and non-adopters.
- What works well and what doesn’t? What manual steps and ‘workarounds’ are used? Is dual entry involved? What are the various moving parts for the data? Significant pain points?
These are huge questions and should go a long way to finding out some of the reasons why adoption is so low.
Research activities
What am I going to do in order answer the Key Questions?
- Stakeholder Interviews — Purpose: Define project goals, requirements & expectations for the system — Team alignment for the project and/or highlight conflicts, differences in expectations etc.)
- Interviews — 1:1 with our own internal Payroll Administrator (The company use HCM but not for payroll)
- Process Mapping of Customers Current Payroll Process — Purpose: Process map highlighting common problems, gaps in information / pain points encountered during payroll and how Payroll Admin addresses & deals with them
- Contextual Inquiry with Payroll Admin Users — Purpose: Observation of user during payroll process, steps taken and tools used, (spreadsheets, post-its, phone calls, emails), workspace environment, (lighting, space & position), general user feedback and answers to open ended questions, key quotes.
Measures of success
- We understand the needs of the Payroll Processing Clerk / Admin
- We understand what their current solution is
- We have enough information to move into the Concept stage
- We’re reasonably confident why 85% of HCM clients are not using Payroll Connect
Download: Research plan template
The Research
Stakeholder interviews
I interviewed 3 key project stakeholders. These were the product’s General Manager, the Product Manager and the Strategic Marketing Manager. I conducted these for 2 main reasons:
- To gather initial high level expectations/requirements & measures of success.
- Alignment. It’s critical that the key stakeholders in such a project are aligned. There was a lot of time and investment going into this piece of work and we wanted to do our best to avoid changes further down the road.
Fortunately for us, everyone was pretty much on the same page. However, it was interesting to hear how thinking varied from one to the other. Even though the direction was aligned the reasons for wanting it differed from say the point of view of the Marketing Strategist to the Product Manager. And while it didn’t affect this particular piece of work, there were slightly differing views on the longer term strategic thinking.
Download: Stakeholder interview template
Internal Interview with Payroll Admin
As a precursor to visiting customers I thought it would be a good idea to do a ‘dry-run’ of the mapping session & user interview with our own internal Payroll Administrator and Finance Manager.
This session gave us chance to refine the mapping technique, test our questioning and our hardware for recording the Contextual Inquiry/User Interview.
We were lucky in that it was a perfect warm-up to the client visits as the company utilise HCM for core HR purposes but not for payroll. But even if the match isn’t perfect in future, I would highly recommend organising a ‘Dry-run’ session of some kind prior to customer visits. Even if it’s just with your UX team-mates.
Onsite visits
This was a pretty intense trip. 1 week in the US. 4 customers. 10 flights in total and 4 States in 5 days.
Process Mapping —Taking part from our team was myself, the Product Manager & Business Analyst. From the customer’s side there was a mixture of Payroll Administrator, Finance Manager, HR Administrator, HR Manager.
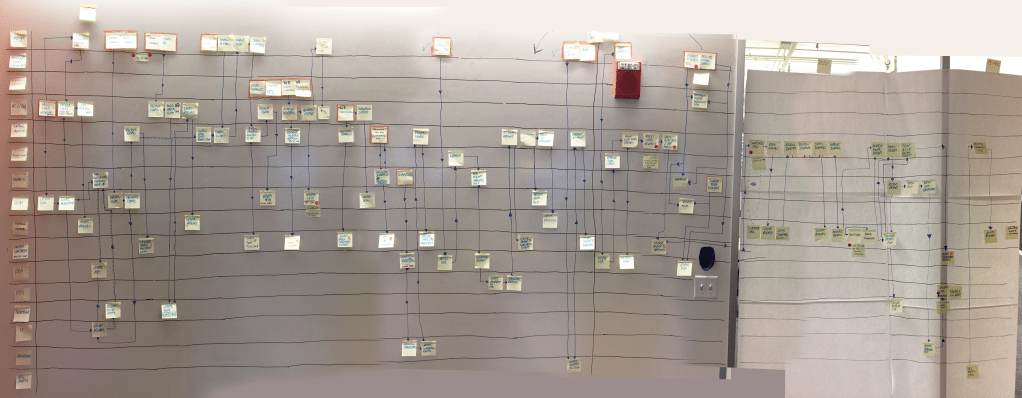
The idea was to create a swimlane style diagram. Stakeholders, systems, artifacts down the left and key stages of the process across the top. Start with the first ‘domino’ towards the left… what kicks things off? and carry on from there. The hardest part is knowing what to ask and when… how to tease the correct info from the participants if they get stuck or we got lost. But we got there eventually. It took around 3–4 hours to complete the mapping each time. Example below.
Once finished I asked the participants to return to the start of the flow, walk through from begining to end and stick red dots on any difficult / unhappy steps. These are the ‘pain points’. In addition to the red dots, they added a post-it next to it with a few notes explaining why these were issues.
Some steps in the process were repeated but rather than re-use the same post-it by pointing to it with numerous arrows I felt it best to add another post-it for each, in order to visualise the repetition. Especially if it’s a potential pain point. This way the diagram emphasises the issues and brings them to the surface more clearly.
Contextual Enquiry — Most of these weren’t CIs in the strictest sense. Out of the 4 clients we visited only 1 of them was running payroll during our time there, 2 gave ‘walkthroughs’ of their tasks and 1 was a remote company with no offices. But seeing them in person was still very worthwhile.
Key ‘take-aways’ from these sessions
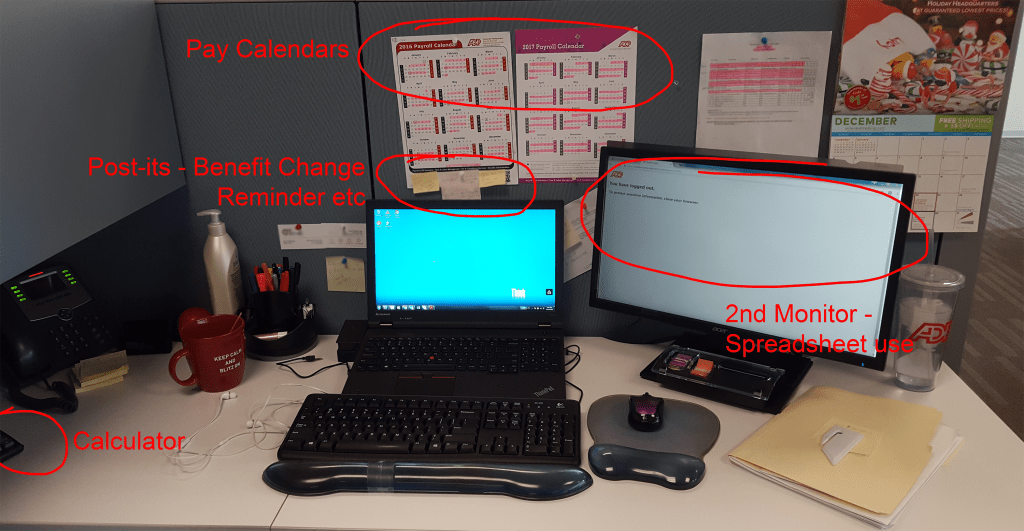
- It didn’t really matter that they weren’t actually running payroll at the time. Sitting in their environment, watching them in their workplace was invaluable. How close they were in proximity to other team members in the process, seemed to have an affect on the communication techniques being used. In the image below you can see I’ve highlighted some of the artifacts in use at a user’s workstation. Payroll calendars, post-it reminders for payroll actions, calculator, 2nd screen for spreadsheet use. These were common throughout and such observations had a big influence in the post research Design Workshop.
- In a 1:1 situation the user in question opened up far more about their day to day tasks and struggles than they did during the group mapping activity.
Make sure you’re well prepped. I had a fairly standard list of warm-up questions (name, role, how long in role, what’s a good day / bad day etc.) But I also had a list of questions specific to the process and the user in question that I wanted to get answers to before we left. Not a script, that doesn’t work as there’s too many variables to take you off-track, rather a checklist to make sure you have something to go back to when you do go off-track. Some of these questions will have been covered in the mapping session but if they’re important enough they can be worth re-visiting in a 1:1 situation. You’ll be surprised at the difference in response.
At this point I also asked a few additional questions. What were the user’s ‘key thoughts & feelings’ during each of the main stages of the process and could they give a score of 1–10 for each step, 1 being very unhappy, 10 being very happy. When combined with their lane of the process map, it would give me enough data to produce a detailed User Journey Map. This was a time saver.
Time between visits was short but whether we were stood waiting for our next flight in an airport or in a hotel lobby just after checking in, we got together and collated our thoughts & observations on the session and saved these to a Google Doc. One for each visit.
Analysis of data
We had video recordings of the 1:1 interviews and screen walkthroughs and we had photos of the finished process maps. These were useful and I did re-visit them after the trip to make additional notes, but key to the research stage being transitioned in a speedy manner to the concept stage, was those daily observation documents. I can’t recommend this step enough.
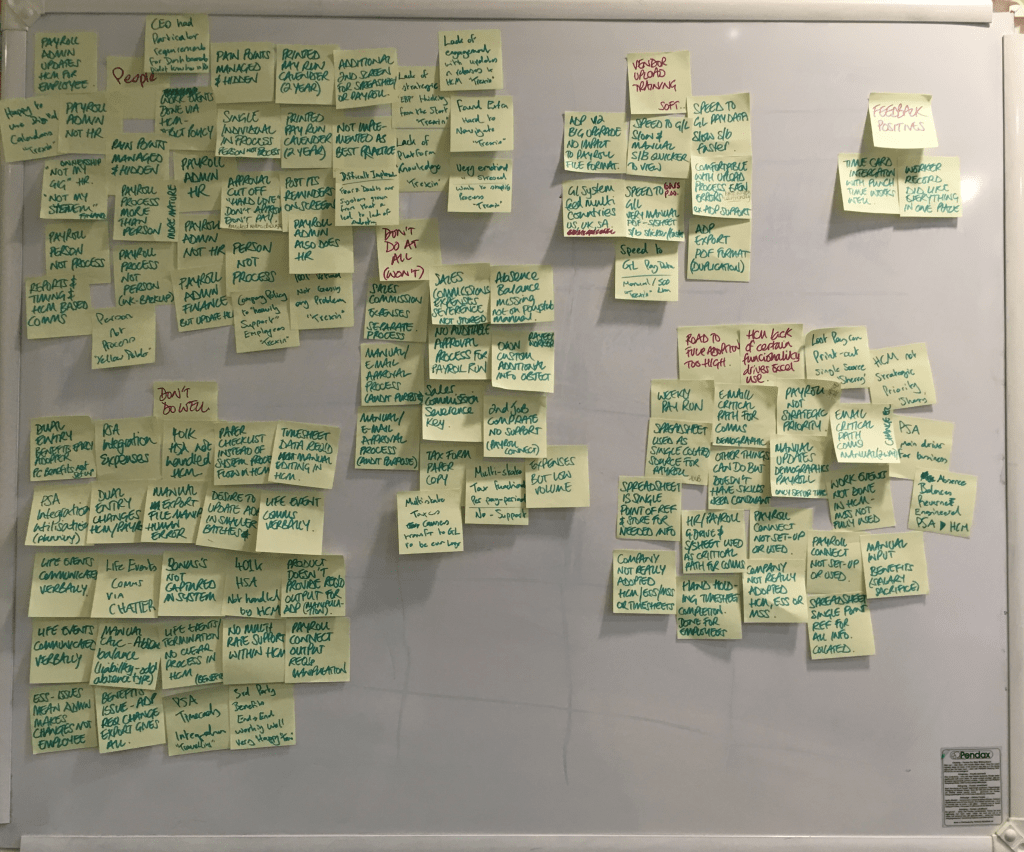
The main technique we used to filter the final collated data was Affinity Mapping. We wrote each observation from those daily Google Docs onto a post-it and stuck them onto a white-board and grouped them. This took 2 or 3 passes, each time refining the group’s content and in some cases the group’s name.
Findings
The observations were sorted into the following groups:
- People — processes based on personal preference or team structure (eg. Payroll Admin sometimes sat in HR, sometimes in Finance. Was it actually a process in place or a person?)
- Things the system doesn’t do well
- Things the system doesn’t do at all
- Road to adoption too high / out of reach
At this point, we had essentially got the answers we needed to the main questions that the research was trying to answer. Without going into too much detail the four groups above all contained issues that contributed towards a lack of adoption. But not only that, there were crossovers between them. All four groups were connected.
Next steps
As you can see from the process map, Payroll is huge. It’s not something that can be fixed in one go. It will take numerous projects over a lengthy period of time so the question became, what should we focus on first?
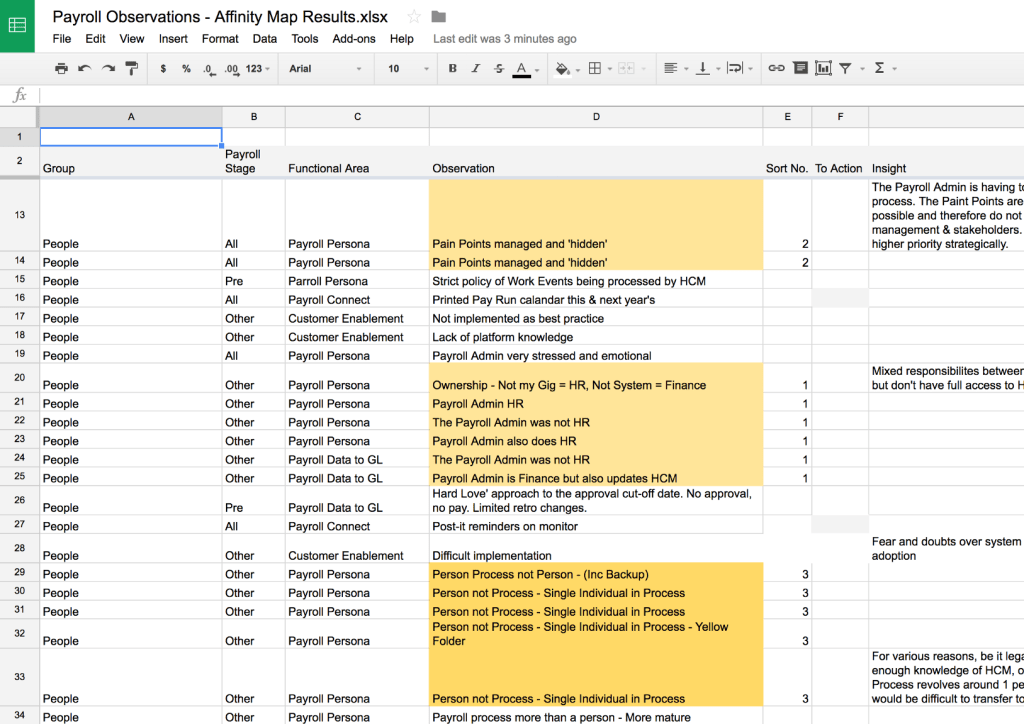
I added the sorted observations & groups to a spreadsheet. Additional columns were added to further organise and filter the data, such as: which stage of payroll was affected? what functional area of the app did the observations belong to? The ‘insight’ and then grouping related observations together.
The final step in deciding which of these issues were going to be actioned was to some degree done for me. I made a list with 4 columns, 1 for each group, each one with our top prioritised observations. These were then filtered down by removing the following: Those that were already on our roadmap for the coming 12–18 months. Those that were being dealt with in an upcoming release. Those that were out of our control and were down to customer’s internal processes.
This left a list of 5 observations
- “Would like to have everything I need in 1 place” (don’t do well)
- An Approval process (don’t do at all)
- Paper checklist instead of system process flow in app (don’t do at all)
- App doesn’t match mental model of user process (Road to adoption too high)
- App is hard to navigate (People)
And it’s these that we took into the next stage. The Design Workshop.
